
1 km Visible
This product has the highest resolution of any of the products. It is used for monitoring mesoscale weather features such as cloud cover, air mass boundaries, convergence zones, thunderstorms, and local snow cover. Limited to daytime use.
2 km, 4 km, 8 km, and 12 km Visible
Depicts same weather phenomena as the 1 km visible - cloud cover, air mass boundaries, convergence zones, thunderstorms, surface lows, and snow cover, but on a larger scale. Limited to daytime use.
Short Wave IR2
Images at this wavelength consist not only of radiation emitted by the earth atmosphere system, but also reflected solar radiation. Useful for fog and other liquid water cloud identification, cloud phase changes, distinction of cloud cover over snow fields, and fire detection.
Water Vapor IR3
The water vapor channel senses radiation emitted from high clouds and upper level water vapor. This imagery is used to define upper level flow patterns, upper level circulations, and shortwaves moving through the flow.
Thermal Infrared IR4
Used for monitoring cloud top and surface temperature, cloud cover, air mass boundaries, convergence zones, surface lows and thunderstorms both day and night.
Fog/Reflectivity Products
Both of these products are created from the thermal infrared and the shortwave infrared channels. With the fog product, fog and other liquid water clouds can be tracked during the night. The reflectivity product, used during daylight hours, has use in the determination of low clouds over snow fields, the identification of cloud phase, and fire detection. Both channels may be used in conjunction with the longwave infrared channel in the determination of supercooled liquid water clouds.
Effective Radius
This product retrieves the effective radius of all clouds whose 10.7 �m brightness temperature is colder than -40 C. Pixels warmer than -40 C are replaced with the 10.7 �m brightness temperatures (grayscale), while the effective radii are assigned colors.
The retrieval is performed by first computing the 3.9 �m albedo, then using solar geometry and satellite position along with the 3.9 �m albedo to calculate the associated effective radius from a series of lookup tables. These lookup tables were created by using an observational operator to compute expected 3.9 �m albedos for a wide range of cloud ice crystal sizes and solar geometries. Droxtals are assumed as the ice crystal habit, so scattering phase functions associated with droxtals were used in the model to build the lookup tables.
Research has shown that lower values of ice cloud effective radius are generally associated with high-based thunderstorms with relatively strong updrafts, i.e., the types of thunderstorms common over the Rockies and High Plains during the summer. Additionally, optically thick mountain wave clouds tend to be composed of small ice crystals.
3-Color Vis/SW/IR
This product is a Red-Green-Blue (RGB) combination of three images. The Red color is used to display the Visible Albedo product; the Green color is used to display the Shortwave Albedo product; and the Blue color is used to display the IR window band (10.7 �m). The Visible Albedo is the solar-zenith-angle-corrected visible (0.7 �m) radiance, corrected to appear as if the sun is overhead at all locations. The Shortwave Albedo is the reflected component only of the Shortwave (3.9 �m) radiance, which is also solar-zenith-angle-corrected to appear as if the sun is overhead at all locations. This product shows non-snow-covered land surfaces as either gray/green, low/water clouds as white, and high/ice clouds as magenta. Snow-covered land surfaces are a different shade of magenta. Also, because of the shortwave band, hot spots from fires may appear in the cloud free areas. This product changes at night when the visible and reflected component of the shortwave bands change characteristics, so it is most useful during the day.
Floater
This loop is centered over a weather feature of interest. It can display any of the GOES channels. See the corresponding MORE INFO button at main menu for information on the imagery displayed in this current loop.
GOES 4-panel Water Vapor Bands (3 Sounder and 1 Imager)
This 4-panel product contains the 3 Sounder and 1 Imager) Water Vapor bands, each of which is described separately (below). These bands attempt so display the 3-dimensional water vapor structure of the atmosphere, with the Imager WV band mapped into the same projection as the 3 Sounder WV bands, Arrangement of the panels is from highest in the atmosphere in the upper-left, to lowest in the atmosphere in the lower-right.
GOES Sounder Upper-Level Water Vapor (6.5 µm, ~300 hPa)
The central wavelength for this water vapor band is at 6.5 µm, with a vertical weighting function peak at about 300 hPa, the highest of the three Sounder water vapor channels.
GOES Sounder Middle-Level Water Vapor (7.0 µm, ~500 hPa)
The central wavelength for this water vapor band is at 7.0 µm, with a vertical weighting function peak at about 500 hPa, the middle of the three Sounder water vapor channels.
GOES Sounder Lower-Level Water Vapor (7.4 µm. ~700 hPa)
The central wavelength for this water vapor band is at 7.4 µm, with a vertical weighting function peak at about 700 hPa, the lowest of the three Sounder water vapor channels.
GOES Imager Water Vapor (5.8 � 7.3 µm, ~400 hPa)
This broad water vapor band senses radiation emitted from high clouds and upper level water vapor. This imagery is used to define upper level flow patterns, upper level circulations, and shortwaves moving through the flow.
GOES Sounder Longwave IR Window (band-8, 11 �m)
Used for monitoring cloud top and surface temperature, cloud cover, air mass boundaries, convergence zones, surface lows and thunderstorms both day and night.
GOES Sounder Skin Temperature
The GOES Sounder skin temperature product represents the radiative skin temperature of the earth's land or water surface. This product is generated by correcting the GOES IR window channel for atmospheric absorption effects, those mainly due to water vapor absorption. By using both the IR window channel (channel-8, 11. �m) and the "dirty" window (channel-7, 12. �m), atmospheric absorption can be estimated. The absorption is effectively determined as the temperature difference between the two window channels. This temperature difference is doubled to reflect the amount of atmospheric absorption in the window channel (based on theoretical calculations) and added back into the GOES window channel to determine a temperature without atmospheric effects. The amount of temperature correction is typically small, even when doubled, and is usually only a few degrees Celsius at most. The temperature correction can also be negative. In those cases the surface is colder than the air above the surface, as occurs in temperature inversions. The areas of negative temperature differences are the color-enhanced areas in the longwave IR difference product.
GOES Sounder Longwave IR (channel-8 minus channel-7) Temperature Difference
This product is the temperature difference between two longwave IR channels of the GOES Sounder, channel-8 (11 �m) a "clean" window channel and channel-7 (12 �m) a "dirty" window with some atmospheric absorption. The temperature difference between these channels is usually positive, with small negative differences possible. Larger positive differences (dark areas) are usually caused by differential transmission thru semi-transparent ice clouds, such as cirrus; and smaller positive differences (lighter gray areas) are normally observed over land. These smaller differences are the result of differential absorption usually due to low-level moisture, with more moisture causing more difference between the channels (darker as opposed to lighter areas). However moisture is not the only cause of a difference between the channels. Small differences between the channels may also be the result of ground surfaces with low emissivity (less than the assumed emissivity of 1.0) or may be the result of surface temperature inversions. These inversions sometimes cause negative differences between the channels (the whitest areas).
GOES Imager Longwave IR (channel-4 minus channel-6) Temperature Difference
This product is the temperature difference between two longwave IR channels of the GOES Imager, channel-4 (10.7 �m) a "clean" window channel and channel-6 (13.3 �m) a window with some atmospheric absorption. With the loss of Imagery channel-5, the "dirty" window, this temperature difference is the closest currently-available difference from the GOES Imager to the former split-window temperature difference, which is still available from the GOES Sounder. Although influenced by temperature differences in the lower atmosphere, this difference can be used in non-cloudy locations to observe the temperature lapse rate at the surface. Temperature inversions are likely found where the product is blue (negative temperature differences) and super-adiabatic temperature lapse rates are likely found where the product is red (positive temperature differences).
GOES Sounder Day/Night Albedo
The GOES visible albedo product effectively enhances the visible channel images, creating a product that brightens up darker areas of the image due to low sun angle. The solar zenith angle at every image pixel is used to generate an isotropic albedo, independent of sun angle. At night, or for the night portion of images containing the terminator, the shortwave IR albedo product (see this product for an explanation) is substituted in place of darkness. This creates a continuous display of cloud features day and night. Low-level water clouds appear white both day and night. Higher-level ice clouds, such as cirrus, appear dark at night, white during the day.
GOES Sounder Shortwave IR Albedo
This is the same product as the shortwave IR albedo derived using GOES Imager channels 2 and 4, but using Sounder channel-8 (longwave IR, 11 �m) and channel-18 (shortwave IR, 3.7 �m). See the equivalent Imager product for an explanation of how this product is generated. Low-level water clouds appear white both day and night. Higher-level ice clouds, such as cirrus, appear dark at night, white during the day.
GOES Imager Water Vapor
The water vapor channel senses radiation emitted from high clouds and upper level water vapor. This imagery is used to define upper level flow patterns, upper level circulations, and shortwaves moving through the flow.
GOES Day/Night Albedo
The GOES visible albedo product effectively enhances the visible channel images, creating a product that brightens up darker areas of the image due to low sun angle. The solar zenith angle at every image pixel is used to generate an isotropic albedo, independent of sun angle. At night, or for the night portion of images containing the terminator, the shortwave IR albedo product (see this product for an explanation) is substituted in place of darkness. This creates a continuous display of cloud features day and night. Low-level water clouds appear white both day and night. Higher-level ice clouds, such as cirrus, appear dark at night, white during the day.
Principal Component Image (PCI) transformation of GOES Imager channels
Principal component analysis (or eigenvector/eigenvalue analysis) is a technique that can be used to help interpret the information content of multi-spectral satellite imagery. This technique determines which part of the multi-spectral signal is common to all the channels (or bands) and separates that information from other image information which is sensed by smaller numbers of channels or by individual channels only. Whereas the original images may (and often do) contain redundant information, the component images contain independent information separated out of the original images. This allows the image analyst to see the independent components in multi-spectral imagery.
The number of component images resulting from a principal component transformation is equal to the number of channel images input, and those component images contain the same information as the original imagery. The components also have the same explained variance as the original data, but in a new order. Another way to look at the transformation is to consider the new components as a new coordinate system, where each component is a linear combination of the inputs so that the maximum amount of variance can be explained by the first component image, then the second component image, etc., down to the last component image. In the simplest case of two image channels, the new component images are a transformation of the original non-perpendicular axes (channels) into: a first component image (a channel combination) which explains most of the variance in the two channels; and a second component image (another channel combination) which explains the remaining variance that is not common to the two channels. In that two-dimensional case the component images are the average and difference images. In a three-channel case the problem can be visualized as a transformation of axes in three-dimensional space. But for increasing numbers of channels the problem is increasingly harder to visualize. The concept is easiest to explain when simplified to a small number of channels or dimensions.
In the case of GOES Imager, the Principal Component Image (PCI) transformation of all 5 GOES channels yields a set of 5 PCIs that help explain what is seen in the original channels. The 5 Imager PCIs are displayed two ways: 1) The 4-panel display contains 4 of the 5 PCIs, the 4 PCIs deemed best at detecting volcanic ash and/or fire hot spots and smoke; 2) The 3-color display contains 3 PCIs as primary colors in a 3-color/RGB image combination. The choice of the PCIs and the colors is up to the user, but has been thought to be best at detecting volcanic ash and/or fire hot spots and smoke. For more information on PCIs and these particular PCI products in particular, contact Don.Hillger AT noaa.gov
GOES Shortwave IR Albedo
The GOES shortwave albedo product is generated by subtracting the equivalent thermal radiance in the shortwave IR channel (3.9 �m) using the longwave IR (10.7 �m) temperature. This is done using the same formula day or night, whether or not there is reflected solar radiation. Since the surface albedo and emissivity are inversely related, areas that reflect solar radiation during the day are actually areas with lower emissivity or a radiance deficit, compared to the longwave IR channel, at night. The solar zenith angle at every image pixel is used to generate an isotropic albedo, independent of sun angle. This new product, which emphasizes low-level water cloud features, may replace the combined nighttime fog / daytime reflectivity product which is generated differently night and day.
GOES Skin Temperature
The GOES skin temperature product represents the radiative skin temperature of the earth's land or water surface. This product is generated by correcting the GOES IR window channel for atmospheric absorption effects, those mainly due to water vapor absorption. By using both the IR window channel (channel-4, 10.7 �m) and the "dirty" window (channel-5, 12.0 �m), atmospheric absorption can be estimated. The absorption is effectively determined as the temperature difference between the two window channels. This temperature difference is doubled to reflect the amount of atmospheric absorption in the window channel (based on theoretical calculations) and added back into the GOES window channel to determine a temperature without atmospheric effects. The amount of temperature correction is typically small, even when doubled, and is usually only a few degrees Celsius at most. The temperature correction can also be negative. In those cases the surface is colder than the air above the surface, as occurs in temperature inversions. The areas of negative temperature differences are the color-enhanced areas in the longwave IR difference product.
GOES Longwave IR (channel-4 minus channel-5) Difference
The longwave IR difference is generated as the change in temperature between the IR window channel (channel-4, 10.7 �m) and the "dirty" window (channel-5, 12.0 �m). This temperature difference is due to changes in atmospheric absorption or transmission between the two channels. The transmission differences are mainly due to clouds that allow different amounts of surface radiation to reach the satellite. The largest positive differences (dark areas) are generally due to differential transmission thru thin cirrus clouds. The absorption differences are mainly due to low-level water vapor when the dirty window has a lower radiative temperature than the "clean" window channel. Smaller positive differences (lighter gray areas) indicate changes in low-level moisture, which are most significant in the summer, with more moisture causing more difference between the channels (darker as opposed to lighter areas). Negative differences (the whitest areas) can occur when the surface is colder than the air above the surface, as in temperature inversion situations.
AMSU Product 1 - Total Precipitable Water
Column integrated water vapor amount. The scale is in half inch (12.5 mm) increments from zero to three inches (75 mm). Gray indicates that no retrieval is possible, for example, where heavy rain is occurring. [Retrieved by the NOAA/NESDIS Microwave Sensing Group.]
AMSU Product 2 - Rain Rate
The instantaneous rainfall rate. Green: 0-10 mm/hr. Red: 10-35 mm/hr. Gray indicates that no retrieval is possible, for example, over sea ice. [Retrieved by the NOAA/NESDIS Microwave Sensing Group.]
AMSU Product 3 - Channel 7 Brightness Temperature
Brightness temperature at 54.9 GHz. Range: 207.7 K to 233.2 K.
AMSU Product 4 - Cloud Liquid Water
Column integrated liquid water amount. Navy: zero. Light blue through magenta: >0 to 6 mm. [Retrieved by the NOAA/NESDIS Microwave Sensing Group.]
AMSU Product 5 - Sea Ice
Fractional coverage of sea ice. Navy to white: 0-100%. [Retrieved by the NOAA/NESDIS Microwave Sensing Group.]
AMSU Product 6 - Snow Cover
Snow cover. Currently only three values are allowed. Tan: no snow. Red: 50% cover/"old" snow. White: 100%/"new" snow. [Retrieved by the NOAA/NESDIS Microwave Sensing Group.]
AMSU Product 7 - 89 GHz
Brightness temperature at 89 GHz. Black to white: 198 K (or less) to 325 K. The clear ocean is dark because its low emissivity causes it to have a low brightness temperature. Water vapor and cloud liquid water brighten the image. Land has a high emissivity and thus appears bright. Scattering by ice particles in clouds (or snow) causes very low brightness temperatures (dark spots).
AMSU Product 8 - 150 GHz
Brightness temperature at 150 GHz. Black to white: 198 K (or less) to 325 K. 150 GHz images are similar to 89 GHz images except that (1) they are generally brighter because the atmosphere is less transparent at 150 than at 89 GHz, (2) 150 GHz is more sensitive to scattering than is 89 GHz, and (3) along-track anomalies in the image are the result of radio frequency interference from the HRPT antennas.
Suomi NPP VIIRS Random Granule Products
VIIRS granules in McIDAS-X (M-band example). Example is SDR with bow-tie deletions at ends of granule filled in.

Full granule (768 x 3200)

Center half (768 x 1600)
Suomi NPP VIIRS Products Remapped to Mollweide Projection

Full granule remapped to Mollweide projection
Suomi NPP VIIRS Colorado-centered Products
These images are single-granule VIIRS images remapped into a Polar Stereographic projection and centered over Colorado.
Suomi NPP VIIRS Random CONUS-centered Products
These images are direct-broadcast VIIRS imagery remapped into a Mercator projection and centered over the Continental United States (CONUS).
Cold Air Aloft Products
At air temperatures of -65°C or colder, the jet fuel typically used in passenger and cargo aircraft can begin to gel, an obvious hazard. This web page contains links to 3 sets of 2 loops which display information relevant to monitoring northern latitudes for these regions of cold air aloft. The 3 loops differ primarily in the data source used to create the images � temperature retrievals from the NUCAPS algorithm (CrIS/ATMS instruments on the SNPP satellite), temperature retrievals from the MIRS algorithm (AMSU instrument on the NOAA-18, NOAA-19, MetOp-A, and MetOp-B satellites; SSM/I on the DMSP-17 and DMSP-18 satellites), and temperatures from the GFS analyses.
The SNPP-NUCAPS loops blend the last 14 hours of orbits into a single image covering all longitudes, with the time at the top of the loop corresponding to the time of the latest orbit. The MIRS loops combine the 35 latest orbits of NOAA-18, NOAA-19, MetOp-A, MetOp-B, DMSP-17, and DMSP-18 into single images. Again, the time at the top of the loop corresponds to the time of the latest orbit included in the image. The GFS loops contain analysis data from NOAA's Global Forecast System; the time of the analysis is given at the top of the page.
For each data source two loops are available. The Arctic Overview loop covers 30°-90° N, and the second provides a view over Alaska. In both loops the minimum temperature (°C) between 700 and 100 mb is contoured according to the color bar displayed on the Arctic Overview loop. If temperatures of -65°C or colder exist at or below flight level 450, a '+' sign is displayed. On the Alaska view, the '+' sign is accompanied by two numbers indicating the vertical extent of the layer of cold air, given in units of flight level. For example, a '+' sign in a dark blue region with a 450 to the upper right and a 350 to the lower right indicates that air with a temperature of -65°C or colder exists between flight levels 350 and 450, and the coldest air in that layer is between -65°C and -70°C.
Tropopause Pressure - The northern hemisphere and the CONUS loops of tropopause pressure are constructed from GFS analyses. The pressure contours are given in mb and are based on a 1.5 PVU tropopause. The shading corresponds to surface potential temperature (K). The color scale is given on the northern hemisphere images.
Balanced 700-300 mb Omega - The northern hemisphere and the CONUS loops of 700-300 mb omega are constructed from GFS analyses. The omega contours are every 2 dPa/s, starting at 1 dPa/s and -1 dPa/s. The gray shading represents upward vertical motion, and the light blue shading designates downward vertical motion. Also given are contours of 500 mb height (m). Omega is calculated according to �Derivation and Solution of the Omega Equation Associated with a Balance Theory on the Sphere� (JAMES, Dec. 2017).
Himawari-8 Product Descriptions
Genaral Info About Himawari-8 Products
All Himarawi-8 imagery comes courtesy of the Japanese Meteorological Agency.
Himawari-8 Geocolor
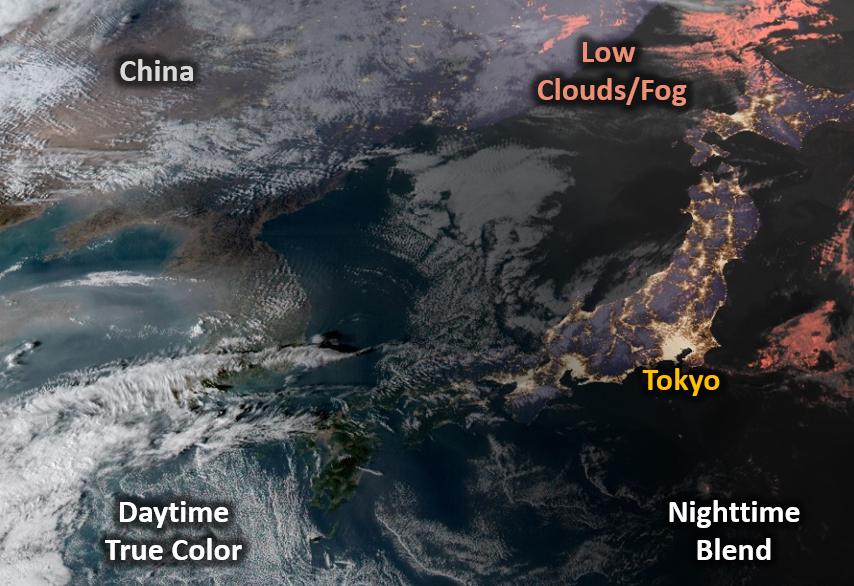
Fig. 1. Example of the Himawari Geocolor product over Japan and the Korean peninsula as day transitions into night. The daytime portion has colors as you'd expect to see with the naked eye, and at night the multispectral image is composed of a static city lights background with ice clouds being shades of gray and liquid water clouds shades of red/pink.
Who is developing and distributing this product?
The Cooperative Institute for Research in the Atmosphere (CIRA) in Fort Collins, Colorado, is developing and distributing the Geocolor product.
Who is receiving this product, and how?
The Himawari Geocolor product is being sent to the National Weather Service's Ocean Prediction Center via LDM, after being converted to a format that can be displayed in their NAWIPS system.
What is the product size?
The size of one image, large but not the full disk, is 17 MB, updates are available every 10 minutes.
Purpose of this product.
The Geocolor satellite imagery product, originally developed at NRL for GOES data and first demonstrated on the NexSat web page (www.nrlmry.navy.mil/NEXSAT.html), takes advantage of Himawari's red, green, and blue visible bands in order to create true color imagery during the daytime. In order to prevent a completely blank image at night, a multispectral product is created that differentiates ice clouds from lower liquid water clouds.
Why is this a GOES-R Proving Ground Product?
Geocolor demonstrates a product that will be possible with GOES-R data. GOES-R will feature the Advanced Baseline Imager (ABI), which is very similar to Himawari's Advanced Himawari Imager, except that the ABI does not have a band in the green portion of the visible spectrum. However, ongoing work at CIRA is using Himawari data to create a synthetic green band for the ABI, so that the resulting true color imagery will look almost exactly like Himawari's true color.
How is this product created now?
The daytime true color portion of the product is created by first performing a Rayleigh correction on the red, green, and blue visible bands, in addition to the 0.86 micrometer "veggie band." This serves to correct for atmospheric scattering and results in a much more crisp image. Since Himawari's green band is centered at 0.51 micrometers, a bit different than the green band on VIIRS and MODIS (0.55 micrometers), a little information from the 0.86 micrometer band 4 is blended with the 0.51 micrometer band in order to make vegetated areas the correct shade of green. Finally, some information from the 10.4 micrometer band 13 is used to estimate cloud top height and to correct some assumptions related to Rayleigh scattering at steep look angles. At night, a static city lights background derived from the VIIRS Day Night Band is combined with data from the 10.4 micrometer band 13 and the 3.9 micrometer band 7. Liquid water clouds are highlighted by shades of red and ice clouds are shades of gray. The cloud layer is given a variable level of transparency depending on the height of the clouds, with high ice clouds being the least transparent.
Advantages and Limitations.
During the daytime, the Himawari Geocolor product provides an intuitive way to identify atmospheric features based on their color. Features such as dust, smoke, and volcanic ash can easily be differentiated from clouds. At night, the color scheme allows liquid water clouds to be easily identified and the city lights provides a very easy way to geolocate the clouds relative to population centers. Limitations include the fact that the product is available at 1 km resolution, since the blue and green bands are not available at 500 m like the red band. So if the focus is looking at small-scale details of clouds, it is probably advantageous to view the 500-m red band alone. Another limitation is that the red shades at night cannot differentiate between low clouds and fog. Lastly, The transparency factor is not based on a retrieved cloud optical depth. Although the relationships used are valid in most cases, there is the potential for semi-transparency behavior in clouds that were in fact optically thick (opaque).